Sylter Fisch Case Study
Our hero “Business Intelligence” today enables data-based decisions and adaptation to dynamic market conditions. This company has also recognized such a need, particularly in the area of assortment design and customer behavior. The increasing competitive pressure in retail as well as rising demands regarding assortment structure and customer orientation reinforce this necessity.
Modern markets are fast-moving, and as a result competition in retail has become very strong. For this reason, the logistics manager of “Sylter Fisch” has taken the initiative that a new BI system is required. After a requirements analysis with the IT department, management approved the project; however, they would like to see timely results. Sylter Fisch is a company known for its seafood products. They operate over 400 branches throughout Germany. They must organize their supply structure in such a way that every branch receives fresh products and controlling can maintain a clear rview.
Currently, the data is processed manually, which is very time- consuming. For example, sales data is used without an automated system. The results of campaigns are hardly measurable. Competition between branches is difficult to analyze and lacks transparency. With the BI system, we will build a new system that clearly visualizes and automates sales analyses. Campaign results will be measured precisely, and new campaigns can be planned on a data-driven basis. The performance of branches will become comparable and overall performance will increase.
In this case study, I will describe a BI prototype with which we can clearly analyze sales data, time trends, product activities, and campaign results. My main objective is to develop a new system in which decisions are made based on data
Identification of the Operational Systems and Data Requirements
In this project, we use three operational sources: POS, ERP, and Marketing Excel. The objective is to provide complete sales information with revenue reference and to prepare it in such a way that later analyses in Power BI are clearly traceable (Time × Product × Branch × Campaign).
POS (Point of Sale)
The cash register systems deliver all individual sales transactions. For analytics, we require at least the following fields:
- SalesID (unique)
- BranchID
- Date (in ISO format yyyy-mm-dd)
- ProductID
- Quantity (units sold)
- Unit price (at the time of sale)
This ensures that the origin of revenue is transparent and traceable for the reviewer.
ERP (Product and Master Data)
The ERP system provides product and branch master data:
- Product: ProductID, ProductName, Category, Origin
- Branch: BranchID, Location, optional Region, Area_sqm
These data serve as dimension tables for later modeling (relational and in Power BI).
Marketing Excel (Campaigns)
The marketing department maintains campaigns in Excel/CSV. For the connection to the fact table, two variants are possible:
- Variant A: Campaigns at product level
CampaignID, CampaignName, StartDate, EndDate, ProductID, Discount_percent - Variant B (flexible): Campaigns with bridge table
dim_campaign (CampaignID, Name, StartDate, EndDate)
bridge_campaign_product (CampaignID, ProductID, optional Discount_percent)
With Variant B, multiple products per campaign can be represented without violating the data model. Later in the ETL process, we mark sales within the campaign period with a flag so that reports can cleanly separate “with/without campaign.”
Data Quality Rules (Minimum)
- Date format consistently ISO (yyyy-mm-dd).
- Quantity ≥ 0; Unit price ≥ 0; Revenue is calculated, not entered manually.
- Missing origin in dim_product temporarily classified as “Unknown” (transparent rule).
- Duplicates in POS rows removed; primary key verified.
Minimal Examples (CSV Structures)
POS – Sales
VerkaufsID,FilialID,Datum,ProduktID,Menge,Einzelpreis (€),Rabatt (%),Umsatz (€)
2001,F002,2025-06-22,P127,1,9.99,10,
2002,,2025-06-17,P130,2,13.49,10,
2003,F004,2025-06-09,P130,3,11.49,10,
2004,F003,2025-06-01,P125,4,9.99,0,
2005,F001,2025-06-21,P130,2,9.99,5,
ERP – Product
ProduktID,Produktname,Kategorie,Herkunft
P100,Produkt_0,Ersatzprodukt,Niederlande
P101,Produkt_1,Feinkost,Deutschland
P102,Produkt_2,Ersatzprodukt,Niederlande
P103,Produkt_3,Dessert,Norwegen
P104,Produkt_4,Ersatzprodukt,
Marketing – Campaign (Variant A)
KampagnenID,Name der Kampagne,Startdatum,Enddatum,ProduktID,Rabatt (%)
K2025-01,Kampagne_1,2025-06-01,2025-06-11,P135,20
K2025-01,Kampagne_1,2025-06-01,2025-06-11,P124,20
K2025-02,Kampagne_2,2025-06-03,2025-06-13,P156,20
K2025-02,Kampagne_2,2025-06-03,2025-06-13,P151,20
K2025-02,Kampagne_2,2025-06-03,2025-06-13,P122,20
. Conception and Implementation of the Data Model
The operational systems from which the data for the BI project originate have now been described. On this basis, a model was developed that structures the information and prepares it for analysis in Power BI. The goal was to create a model that is easy to understand and at the same time represents all important connections between the data.
Basic Idea of the Model
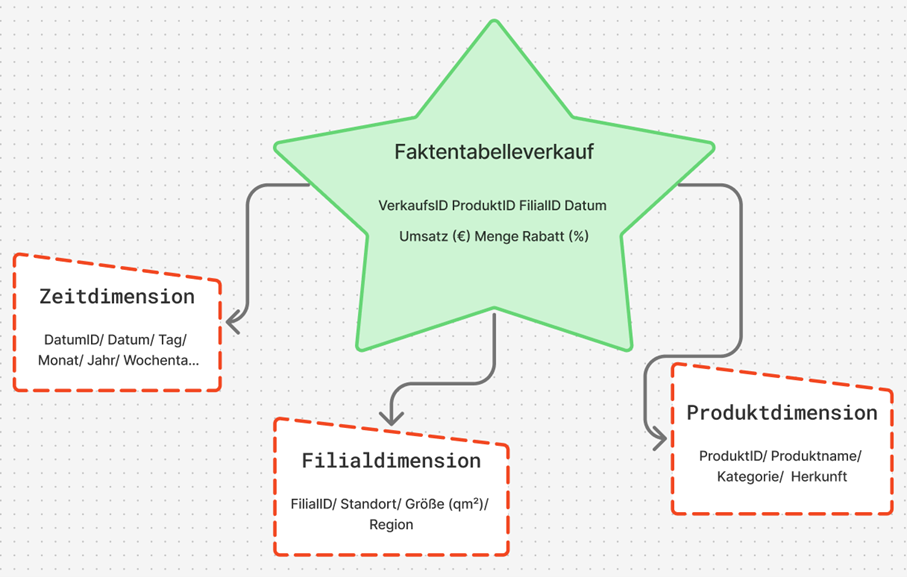
For the project, the star schema was chosen. This schema is clearly structured and well suited for BI applications because it enables fast queries and clear relationships. At the center stands a fact table in which the sales data are stored. It contains all key figures that are later used in analyses, for example the quantity sold, the unit price, the discount, and the calculated revenue.
Revenue was calculated according to the previously defined formula:
Revenue = Quantity × Unit price × (1 − Discount / 100)
Around the fact table, there are several dimension tables that contain additional information. These include:
- Product dimension: Product name, category, and origin
- Branch dimension: Location, region, and size of the branch
- Time dimension: Date, month, year, and weekday.
Through this structure, sales can be analyzed from different perspectives, for example by period, product, or location.
Implementation of the Model
The model was first designed logically and then implemented technically. Each table has a unique key so that the relationships remain unambiguous. The connections follow the classic star pattern. A central fact table stands at the center and is connected to the three dimension tables via key values. In Power BI, these connections are automatically recognized once the files are imported.In the model view, this results in a clear star shape that shows the relationships between the tables.
A brief excerpt of the structure:
- fact_sales - dim_product: Connection via ProductID
- fact_sales - dim_branch: Connection via BranchID
- fact_sales - dim_date: Connection via Date
This simple structure makes it possible to combine data from different sources without requiring complicated joins or long SQL queries.
Calculation and Use of Key Figures
Revenue can either be stored directly in the database or calculated in Power BI. In this work, the second variant was used, as it is more flexible. The calculation was carried out in Power BI using a simple formula that is automatically executed for each row. As a result, the model remains dynamic: if prices or quantities change, the revenue value adjusts automatically.
With this data model, the foundation for the subsequent ETL process has been created. The data are now structured in such a way that they can be cleaned, combined, and analyzed in Power BI in the next step.
ETL Process (Extract, Transform, Load)
The ETL process is a central component of every business intelligence solution. It ensures that data from different sources are collected, cleaned, and prepared for analysis. At Sylter Fisch, the ETL process consists of three steps: extraction, transformation, and loading.
Extract (Data Extraction)
In this step, the data are taken from the operational systems. At Sylter Fisch, they come from three sources. The POS system (sales), the ERP system (products and inventory data) and the Excel files from marketing (campaigns). All data are exported as CSV files because this format is easy to process. The files are stored in a so-called staging area, where they can later be further processed.
Transform (Data Cleansing and Harmonization)
In the transformation phase, the data are checked, cleaned, and standardized. The goal is to obtain clean and consistent information for analysis.
The most important steps include:
- Format adjustment: Date formats are standardized (e.g., “2025-06-10”).
- Error correction: Null values and duplicates are removed.
- Revenue calculation: Revenue is calculated from quantity and unit price.
In this way, no confusion arises regarding the origin of the figures.
For illustration purposes, a small Python script was created that automatically performs the cleansing. Through this simple procedure, it is ensured that all revenue figures are correct and traceable.
BI Prototype
In this chapter, I describe the practical implementation of my business intelligence prototype for the company Sylter Fisch. The objective was to demonstrate the theoretical foundations from the previous chapters especially the data model and the ETL process –in a functioning BI solution. I worked with Python (Pandas) and Power BI.
All scripts, datasets, and screenshots are documented in my GitHub repository:
https://github.com/Elli55/BI-Prototyp
ETL Implementation with Python
The initial data consisted of four CSV files: verkauf.csv, produkt.csv, filiale.csv and kampagne.csv. I processed these files in Google Colab using Python in order to clean them, standardize them, and prepare them for Power BI.
An example from my code:
import pandas as pd
verkauf = pd.read_csv("verkauf.csv")
verkauf['Datum'] = pd.to_datetime(verkauf['Datum'], format='%Y-%m-%d')
verkauf.dropna(inplace=True)
verkauf.drop_duplicates(inplace=True)
verkauf['Umsatz'] = verkauf['Menge'] * verkauf['Einzelpreis']
verkauf['Kampagne_Flag'] = verkauf['Datum'].between('2025-06-01', '2025-06-14')
With this ETL process, all data were cleaned automatically. The automatic revenue calculation was particularly important, as it prevents manual errors. I then saved the cleaned data as new files (produkte_clean, filialen_clean, verkauf_powerbi, Kampaniyalar_zr) and imported them into Power BI.
Relational Data Model
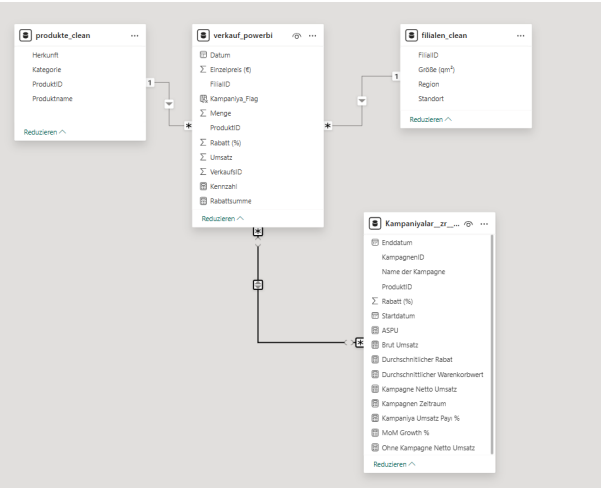
The data model was built in Power BI according to the star schema principle, but in a compact, practice-oriented variant. At the center stands the fact table verkauf_powerbi, which contains all sales and discount information. Around it are three main dimensions as well as a supplementary campaign table in which additional DAX- based key figures are stored.
The relationships were automatically recognized in Power BI:
- produkte_clean[ProduktID] - verkauf_powerbi[ProduktID]
- filialen_clean[FilialID] - verkauf_powerbi[FilialID]
- Kampaniyalar_zr[ProduktID] → verkauf_powerbi[ProduktID]
A separate time dimension (dim_date) was not created, since the date field is directly integrated into the fact table. This makes the model more compact, but still fully suitable for analyses by period, product, region, and campaign.
Data Loading and Validation
After cleansing, I loaded all four files into Power BI. The relationships were automatically recognized and displayed in the model view.
For verification, I created simple DAX formulas to ensure that all revenue figures were transferred correctly:
Umsatz_Total = SUM(verkauf_powerbi[Umsatz])
Avg_Warenkorb = DIVIDE(SUM(verkauf_powerbi[Umsatz]),
COUNTROWS(verkauf_powerbi))
Visualization in the Power BI Dashboard
The finished BI prototype consists of four report pages that cover different analysis objectives. All pages were designed according to IBCS and Hichert SUCCESS principles in order to visualize the information clearly and consistently.
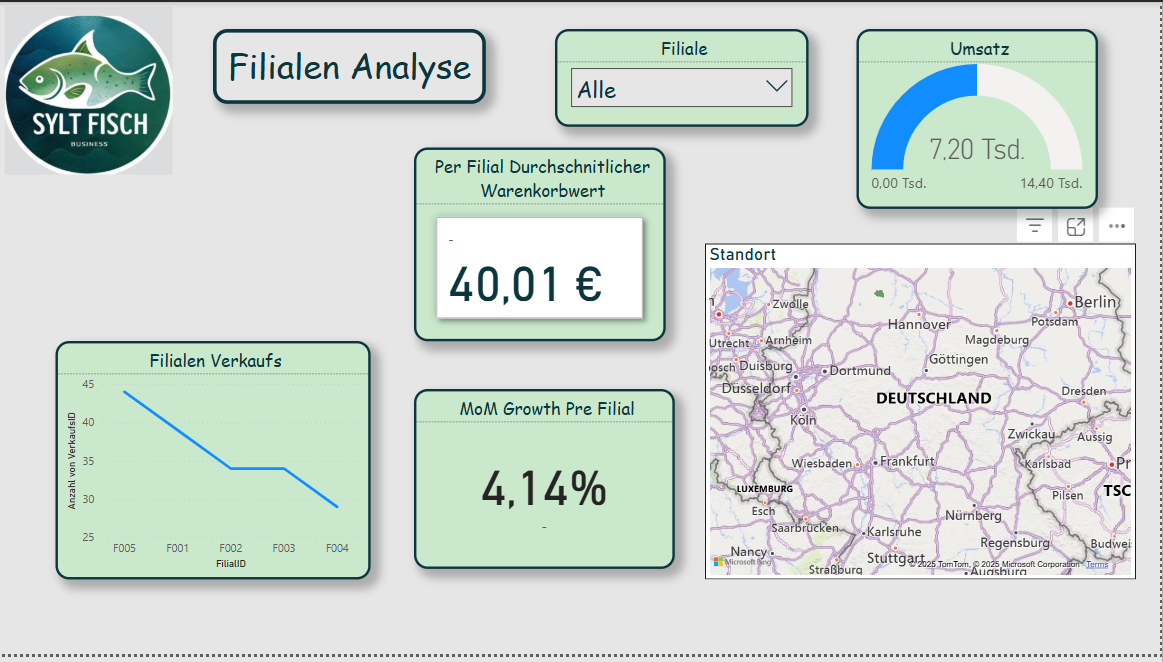
Page 1 - KPI Overview
This page serves as a management cockpit and displays the most important performance indicators at a glance:
- Total revenue
- Average basket value
- Monthly revenue growth (MoM)
- Top 3 products by revenue
Example DAX formula for monthly growth:
Umsatz_MoM =
VAR PrevMonth =
CALCULATE([Umsatz_Total], DATEADD(verkauf_powerbi[Datum], -1, MONTH))
RETURN DIVIDE([Umsatz_Total] - PrevMonth, PrevMonth)
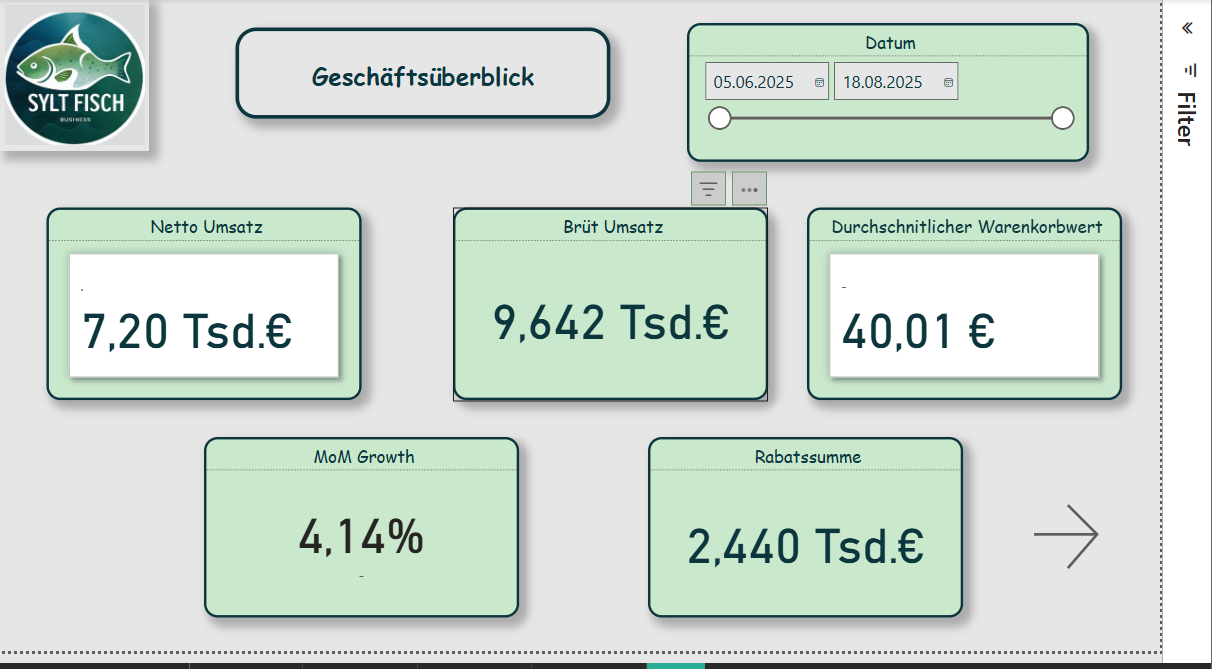
A line chart shows the revenue trend, and next to it KPI cards provide quick decision support. This page gives management an overview of the current business trend.
Page 2 - Product Analysis
Produkt_Umsatz = SUMX(verkauf_powerbi, verkauf_powerbi[Menge] * verkauf_powerbi[Einzelpreis])
Example DAX:
Umsatz_Pro_Qm = DIVIDE(SUM(verkauf_powerbi[Umsatz]), SUM(filialen_clean[Flaeche_qm]))
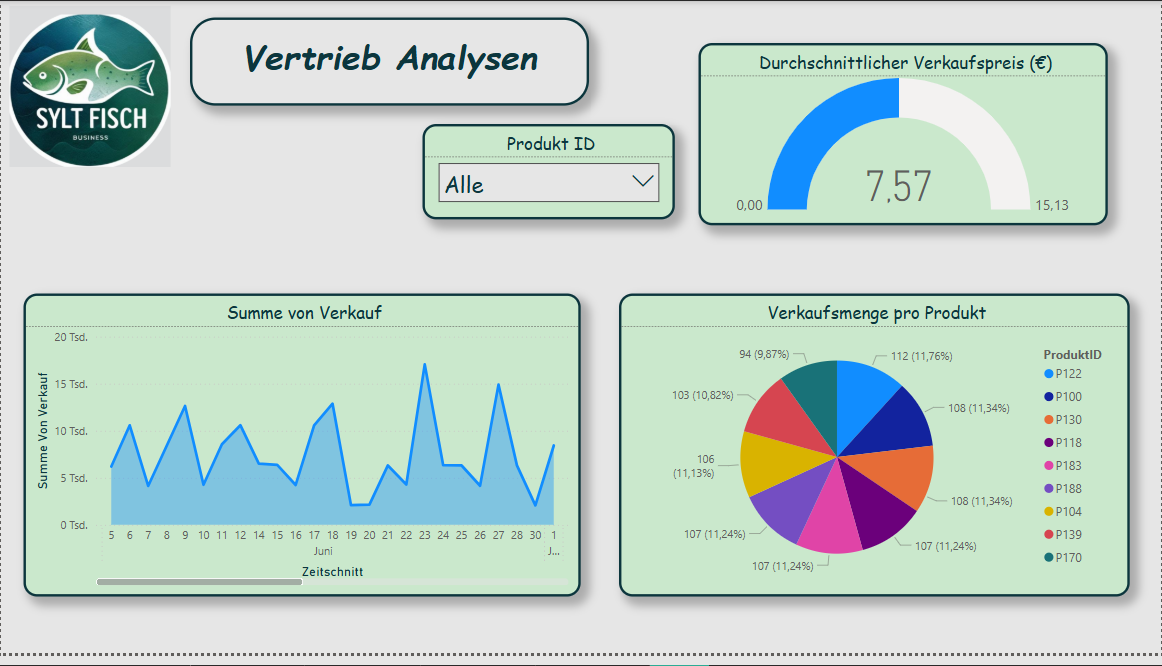
Through filters (e.g., category or product name), one can easily recognize which products generate the most revenue or show seasonal fluctuations.
Page 3 - Geographic Analysis
This page shows regional differences between branches. For this purpose, the table filialen_clean was used.
- Map visualization: Revenue per branch
- Table: Revenue per square meter (Flaeche_qm)
DAX formula:
Umsatz_Pro_Qm = DIVIDE(SUM(verkauf_powerbi[Umsatz]), SUM(filialen_clean[Flaeche_qm]))
With this analysis, it becomes immediately visible which regions perform better or weaker. This is particularly helpful for logistics and location optimization.
Page 4 - Campaign Analysis
This page analyzes the success of discount campaigns. Sales during a campaign (Kampagne_Flag = TRUE) are compared with non-campaign sales.
Kampagnen_Umsatz =
CALCULATE(SUM(verkauf_powerbi[Umsatz]),
verkauf_powerbi[Kampagne_Flag] = TRUE)
NichtKampagnen_Umsatz =
CALCULATE(SUM(verkauf_powerbi[Umsatz]),
verkauf_powerbi[Kampagne_Flag] = FALSE)
Rabatt_Durchschnitt = AVERAGE(Kampaniyalar_zr[Rabatt (%)])
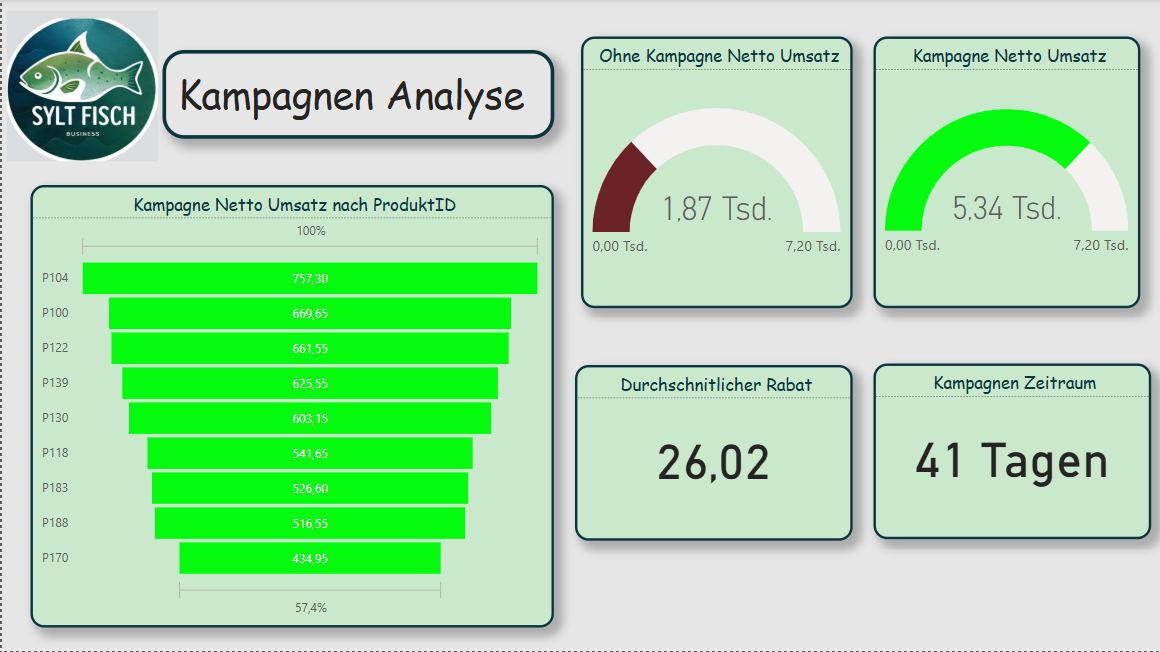
The visualizations consist of column charts, KPI cards, and a product table with the best promotional items. In this way, the marketing team can directly see which campaigns actually led to revenue increases.
Result and Benefit
The developed BI prototype for Sylter Fisch shows how operational data from different sources can be combined in a compact, clearly structured model. Through the combination of Python (for ETL) and Power BI (for visualization), a flexible system is created that:
- transparently presents sales figures,
- highlights regional differences,
- makes campaigns measurable,
- supports data-based decisions.
The project proves that even with manageable resources, a professional, agile BI solution is possible a first step toward a data-driven corporate culture at Sylter Fisch.
Reflection and Answer to the Assignment
In this case study, it was shown how a business intelligence system can be built for the company Sylter Fisch. The goal was to develop a solution that combines sales data from different sources and thus enables data-based decision-making. In the following, it is briefly reflected how the assignment was fulfilled and which results were achieved.
Identification of the operational systems:
The three used sources (POS, ERP, and Marketing) were clearly defined and described. The POS data delivered the sales information, the ERP system provided the product and branch data, and the marketing Excel file supplied the campaigns. This established a complete foundation for later analysis.
Data modeling:
The star schema was chosen as the logical model. It contains a fact table for sales data and several dimension tables (product, branch, date, campaign). This structure was technically implemented in Power BI and allows clear and fast evaluations.
ETL process:
The ETL process was implemented using Python (Pandas). The data were cleaned, standardized, and enriched with additional key figures (e.g., revenue, Kampagne_Flag). The code transparently shows how the data were processed and prepared for Power BI.
Visualization and analysis:
The Power BI dashboard consists of four pages: KPI overview, product analysis, geographic analysis, and campaign analysis. Each page presents different perspectives and enables management decisions based on data. In particular, the comparison of branch revenues and campaign performance provides high added value.
Evaluation of the implementation:
The chosen approach was deliberately pragmatic and easy to implement. Python and Power BI complement each other well in order to create a functioning, agile BI system. For a future version, the use of a SQL database as a physical foundation would be useful to design data storage even more professionally.